Black Swan
Cygnus atratus
ABR description
The following is extracted from the Annual Bird Report for the twelve months to June 2017.
Common, breeding resident
Regularly observed on bodies of water throughout the region.
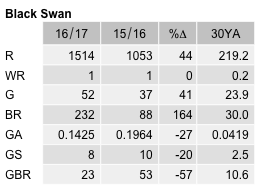
General: From the low numbers reported last year there has been an increase to more normal levels; abundance (1.01 cf 0.5 last year) and average numbers of birds (9.5 cf 5.8) last year. The number of grid cells reported from has increased from 37 last year to 57 with the maximum number reported 611/17 May LBath GrZ08 (LeM1). The number of breeding cells has increased from 15 last year to 28.
GBS: 103 records from 8 urban sites. Note misprint in last year’s report (CBN Vol 42 No 1 p3) number of records should be 119 not 19. 23 reports of breeding (all dy) from Giralang (McD4, KaD1), Jerrabomberra (HaL2), Greenway (HaA2) and Acton (RoS1). Maximum 10/3wk Oct LBG Acton (RoS1).
Abundance
Abundance is the average number of birds of that species per survey. Where the species was observed (presence recorded) but the number of birds seen was not recorded, this is treated as a count of zero.
Abundance by year
This chart shows the abundance of Black Swan between 1982 and 2017. 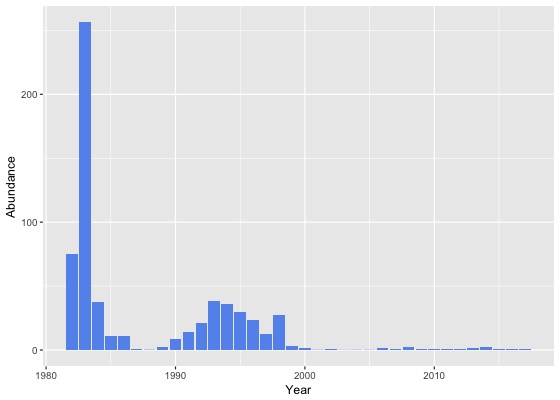
Abundance by month
This chart shows the monthly abundance of Black Swan. The blue lines show the abundance for the twelve months to June 2017 and the bars show the average abundance for the period 1982 to 2017. 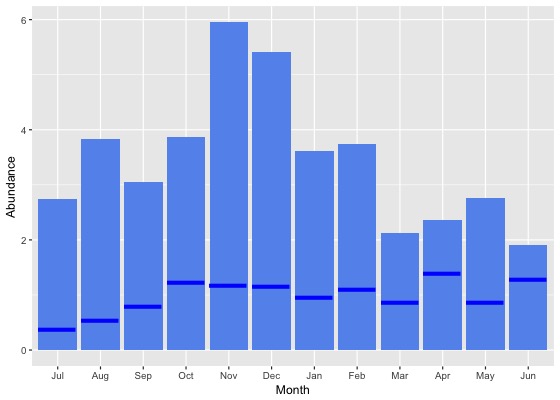
Abundance by season
This chart shows the seasonal abundance of Black Swan. The blue lines show the seasonal abundance for the twelve months to June 2017 and the bars show the average seasonal abundance for the period 1982 to 2017. 
Abundance data
| Month | Season | ||||||||||||||||||
|---|---|---|---|---|---|---|---|---|---|---|---|---|---|---|---|---|---|---|---|
| Period | Jul | Aug | Sep | Oct | Nov | Dec | Jan | Feb | Mar | Apr | May | Jun | Winter | Spring | Summer | Autumn | All | ||
| All years | |||||||||||||||||||
| All | 2.7 | 3.8 | 3.0 | 3.9 | 5.9 | 5.4 | 3.6 | 3.7 | 2.1 | 2.4 | 2.8 | 1.9 | 2.7 | 4.2 | 4.3 | 2.4 | 3.5 | ||
| Previous years | |||||||||||||||||||
| All previous years | 3.1 | 4.5 | 3.4 | 4.2 | 6.7 | 6.1 | 4.1 | 4.3 | 2.3 | 2.5 | 3.2 | 2.0 | 3.1 | 4.6 | 4.9 | 2.6 | 3.9 | ||
| Previous 30 years | 2.9 | 3.8 | 2.9 | 3.6 | 5.8 | 5.3 | 3.5 | 3.3 | 2.1 | 2.3 | 2.6 | 1.8 | 2.7 | 4.0 | 4.1 | 2.3 | 3.3 | ||
| Previous 20 years | 1.9 | 2.4 | 1.8 | 1.6 | 2.2 | 1.9 | 1.0 | 2.3 | 0.8 | 0.6 | 1.1 | 0.6 | 1.5 | 1.8 | 1.7 | 0.8 | 1.5 | ||
| 10 year groups | |||||||||||||||||||
| [2007,2017) | 2.3 | 1.9 | 1.1 | 0.9 | 0.7 | 0.6 | 0.7 | 1.0 | 0.9 | 0.8 | 1.1 | 0.8 | 1.5 | 0.9 | 0.8 | 0.9 | 1.0 | ||
| [1997,2007) | 1.1 | 3.4 | 3.1 | 4.0 | 5.2 | 4.6 | 1.7 | 5.6 | 0.6 | 0.3 | 0.9 | 0.3 | 1.4 | 4.0 | 4.0 | 0.6 | 2.6 | ||
| [1987,1997) | 6.4 | 7.9 | 8.6 | 15.4 | 17.9 | 24.2 | 18.2 | 7.9 | 9.5 | 11.0 | 8.4 | 7.7 | 7.4 | 14.3 | 17.1 | 9.7 | 12.2 | ||
| 5 year groups | |||||||||||||||||||
| [2012,2017) | 2.8 | 2.1 | 1.4 | 1.0 | 0.6 | 0.6 | 0.6 | 1.0 | 0.9 | 0.6 | 1.1 | 0.7 | 1.7 | 1.0 | 0.7 | 0.8 | 1.0 | ||
| [2007,2012) | 1.1 | 1.4 | 0.5 | 0.7 | 0.8 | 0.6 | 1.2 | 1.4 | 0.9 | 1.0 | 1.3 | 0.8 | 1.0 | 0.7 | 1.0 | 1.0 | 0.9 | ||
| [2002,2007) | 0.2 | 1.7 | 1.2 | 1.9 | 0.7 | 0.5 | 0.3 | 0.4 | 0.1 | 0.1 | 0.4 | 0.1 | 0.5 | 1.3 | 0.4 | 0.2 | 0.6 | ||
| [1997,2002) | 2.6 | 5.4 | 5.5 | 7.0 | 10.4 | 10.0 | 3.3 | 10.9 | 1.4 | 0.5 | 1.6 | 0.5 | 2.6 | 7.5 | 8.2 | 1.2 | 5.1 | ||
| [1992,1997) | 15.9 | 17.8 | 19.8 | 37.4 | 49.6 | 69.5 | 39.2 | 19.2 | 21.6 | 22.6 | 17.4 | 18.6 | 17.5 | 36.8 | 43.9 | 20.7 | 29.5 | ||
| [1987,1992) | 2.1 | 2.6 | 3.3 | 3.4 | 2.6 | 4.4 | 6.6 | 3.6 | 2.3 | 4.3 | 3.7 | 1.6 | 2.1 | 3.1 | 4.8 | 3.5 | 3.4 | ||
| Year | |||||||||||||||||||
| 2017 | 0.4 | 0.5 | 0.8 | 1.2 | 1.2 | 1.2 | 1.0 | 1.1 | 0.9 | 1.4 | 0.9 | 1.3 | 0.8 | 1.1 | 1.1 | 1.0 | 1.0 | ||
| 2016 | 0.5 | 1.1 | 1.0 | 0.6 | 0.4 | 0.4 | 0.4 | 0.5 | 0.3 | 0.4 | 0.4 | 0.3 | 0.7 | 0.7 | 0.4 | 0.3 | 0.5 | ||
| 2015 | 6.9 | 3.1 | 1.7 | 1.2 | 0.5 | 0.4 | 0.3 | 0.8 | 0.4 | 0.2 | 0.3 | 0.4 | 2.8 | 1.1 | 0.5 | 0.3 | 1.1 | ||
| 2014 | 5.7 | 4.5 | 2.8 | 2.6 | 1.4 | 0.9 | 1.1 | 2.0 | 1.7 | 1.1 | 3.1 | 0.4 | 2.7 | 2.4 | 1.3 | 1.8 | 2.0 | ||
| 2013 | 1.4 | 2.9 | 1.5 | 0.6 | 1.1 | 0.8 | 1.3 | 1.4 | 2.3 | 1.8 | 2.4 | 3.6 | 2.7 | 1.0 | 1.1 | 2.1 | 1.6 | ||
| 2012 | 0.9 | 0.5 | 0.3 | 0.5 | 0.4 | 0.5 | 0.4 | 1.3 | 0.4 | 0.6 | 1.7 | 0.6 | 0.6 | 0.4 | 0.6 | 0.8 | 0.6 | ||
| 2011 | 1.3 | 1.0 | 0.2 | 0.7 | 0.7 | 0.9 | 0.9 | 0.8 | 0.6 | 1.1 | 1.2 | 0.8 | 0.9 | 0.5 | 0.9 | 0.9 | 0.8 | ||
| 2010 | 0.2 | 0.5 | 0.5 | 0.5 | 0.3 | 0.1 | 0.6 | 1.5 | 0.9 | 0.6 | 1.4 | 0.5 | 0.4 | 0.5 | 0.5 | 0.9 | 0.6 | ||
| 2009 | 0.3 | 0.6 | 0.9 | 0.7 | 0.2 | 0.0 | 1.2 | 0.5 | 0.6 | 0.2 | 0.4 | 0.5 | 0.5 | 0.6 | 0.5 | 0.4 | 0.5 | ||
| 2008 | 0.3 | 2.0 | 1.0 | 1.3 | 3.3 | 1.7 | 3.9 | 4.6 | 2.6 | 1.8 | 3.8 | 1.7 | 1.3 | 1.6 | 3.0 | 2.4 | 2.0 | ||
| 2007 | 3.9 | 3.1 | 0.0 | 0.3 | 0.1 | 0.1 | 0.5 | 0.5 | 0.5 | 1.0 | 0.3 | 0.8 | 1.9 | 0.2 | 0.3 | 0.6 | 0.7 | ||
| 2006 | 0.1 | 8.2 | 2.6 | 2.3 | 3.2 | 2.5 | 0.7 | 0.4 | 0.1 | 0.2 | 0.4 | 0.1 | 1.7 | 2.6 | 1.3 | 0.2 | 1.5 | ||
| 2005 | 0.2 | 0.5 | 0.2 | 0.1 | 0.1 | 0.3 | 0.1 | 0.2 | 0.1 | 0.1 | 0.8 | 0.1 | 0.2 | 0.2 | 0.2 | 0.3 | 0.2 | ||
| 2004 | 0.3 | 0.2 | 0.2 | 0.4 | 0.1 | 0.0 | 0.3 | 1.0 | 0.0 | 0.1 | 0.2 | 0.2 | 0.2 | 0.3 | 0.3 | 0.1 | 0.2 | ||
| 2003 | 0.6 | 0.2 | 0.1 | 0.2 | 0.1 | 0.1 | 0.2 | 0.3 | 0.0 | 0.2 | 0.3 | 0.1 | 0.2 | 0.1 | 0.2 | 0.1 | 0.2 | ||
| 2002 | 0.0 | 0.8 | 3.1 | 5.1 | 0.0 | 0.1 | 0.4 | 0.0 | 0.0 | 0.1 | 0.1 | 0.1 | 0.2 | 2.9 | 0.2 | 0.0 | 0.9 | ||
| 2001 | 0.1 | 0.0 | 0.1 | 0.1 | 0.0 | 0.0 | 0.1 | 0.0 | 1.2 | 0.3 | 0.1 | 0.1 | 0.1 | 0.1 | 0.0 | 0.7 | 0.2 | ||
| 2000 | 0.1 | 0.1 | 0.1 | 0.1 | 1.2 | 1.3 | 6.0 | 4.1 | 0.4 | 0.1 | 0.0 | 0.0 | 0.1 | 0.4 | 3.6 | 0.2 | 1.3 | ||
| 1999 | 12.4 | 7.9 | 4.3 | 2.3 | 0.5 | 7.7 | 1.0 | 1.3 | 3.0 | 1.5 | 1.7 | 1.6 | 4.5 | 2.5 | 3.5 | 2.1 | 3.0 | ||
| 1998 | 0.0 | 33.5 | 23.8 | 52.7 | 34.6 | 36.0 | 6.3 | 109.0 | 2.2 | 0.1 | 19.6 | 0.4 | 10.9 | 35.6 | 44.2 | 4.7 | 27.6 | ||
| 1997 | 10.4 | 5.2 | 13.8 | 3.6 | 32.9 | 38.1 | 4.5 | 5.0 | 0.2 | 0.3 | 0.1 | 0.1 | 5.6 | 18.6 | 21.1 | 0.2 | 12.3 | ||
| 1996 | 4.7 | 30.8 | 3.1 | 2.7 | 70.0 | 43.4 | 28.7 | 17.3 | 12.1 | 16.8 | 3.7 | 24.0 | 21.4 | 27.3 | 30.4 | 11.3 | 23.3 | ||
| 1995 | 19.5 | 18.6 | 12.9 | 33.2 | 61.7 | 100.4 | 35.4 | 0.2 | 32.2 | 12.9 | 15.1 | 8.1 | 15.7 | 35.9 | 48.5 | 19.8 | 29.6 | ||
| 1994 | 27.7 | 19.9 | 50.6 | 62.8 | 49.6 | 89.1 | 63.6 | 10.4 | 32.6 | 20.6 | 18.5 | 5.5 | 15.8 | 53.8 | 52.5 | 23.6 | 35.9 | ||
| 1993 | 7.9 | 8.0 | 2.1 | 79.5 | 25.6 | 79.8 | 68.1 | 90.8 | 6.9 | 56.6 | 37.9 | 45.4 | 21.1 | 38.3 | 78.0 | 31.5 | 38.6 | ||
| 1992 | 18.9 | 4.1 | 31.1 | 30.4 | 22.6 | 46.2 | 12.5 | 9.0 | 23.6 | 19.5 | 8.1 | 16.1 | 13.5 | 28.4 | 24.7 | 16.7 | 21.3 | ||
| 1991 | 5.1 | 4.1 | 12.4 | 12.3 | 18.4 | 20.2 | 52.8 | 16.1 | 7.6 | 17.2 | 17.0 | 3.1 | 4.4 | 14.4 | 29.2 | 13.8 | 14.2 | ||
| 1990 | 2.6 | 2.4 | 8.9 | 13.3 | 3.2 | 18.8 | 14.0 | 13.3 | 6.8 | 18.9 | 11.4 | 7.8 | 3.4 | 8.3 | 15.4 | 12.3 | 8.7 | ||
| 1989 | 0.3 | 2.6 | 1.9 | 1.2 | 1.6 | 1.2 | 2.2 | 3.8 | 2.8 | 3.0 | 3.3 | 1.2 | 1.4 | 1.6 | 2.3 | 3.0 | 2.0 | ||
| 1988 | 0.1 | 0.2 | 0.3 | 0.2 | 0.2 | 0.2 | 0.1 | 0.3 | 0.1 | 0.5 | 1.4 | 0.4 | 0.2 | 0.2 | 0.2 | 0.7 | 0.3 | ||
| 1987 | 32.9 | 39.5 | 1.4 | 1.3 | 0.6 | 1.4 | 1.5 | 0.3 | 0.5 | 0.2 | 0.1 | 0.4 | 4.5 | 1.1 | 1.0 | 0.3 | 1.1 | ||
| 1986 | 2.2 | 24.4 | 6.0 | 11.1 | 5.6 | 5.9 | 13.3 | 7.6 | 15.8 | 7.9 | 28.1 | 13.9 | 14.9 | 7.2 | 8.4 | 15.4 | 11.2 | ||
| 1985 | 6.5 | 21.7 | 8.7 | 7.8 | 14.1 | 4.3 | 32.1 | 14.5 | 16.7 | 14.3 | 16.8 | 6.4 | 11.6 | 9.9 | 9.0 | 15.6 | 10.6 | ||
| 1984 | 28.2 | 10.9 | 246.0 | 126.3 | 341.2 | 102.8 | 35.7 | 31.5 | 0.1 | 8.6 | 15.5 | 12.1 | 13.5 | 195.8 | 44.7 | 8.4 | 37.5 | ||
| 1983 | 137.5 | 138.5 | 384.8 | 335.2 | 478.8 | 157.8 | 550.5 | 368.7 | 653.0 | - | 144.0 | 8.7 | 89.1 | 392.2 | 313.7 | 216.7 | 256.2 | ||
| 1982 | - | 43.9 | - | 0.0 | 4.9 | 187.6 | - | 63.5 | - | 62.1 | - | 53.4 | 49.2 | 4.3 | 133.0 | 62.1 | 75.0 | ||
Reporting rates
Reporting rate is the proportion of all surveys in which the species was present.
Reporting rate by year
This chart shows the reporting rate of Black Swan each year between 1982 and 2017. 
Reporting rate by month
This chart shows the reporting rate by month of Black Swan. The blue lines show the reporting rate for the twelve months to June 2017 and the bars show the average reporting rate for the period 1982 to 2017. 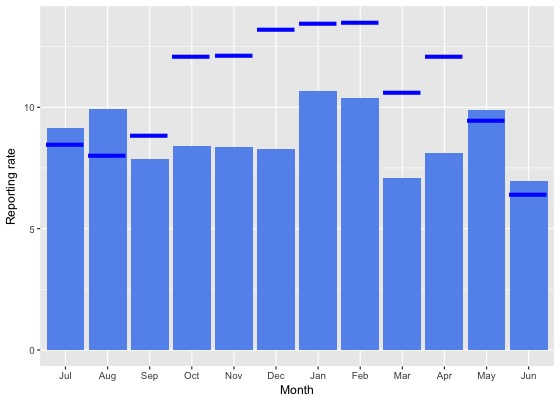
Reporting rate by season
This chart shows the seasonal reporting rate of Black Swan. The blue lines show the seasonal reporting rate for the twelve months to June 2017 and the bars show the average seasonal reporting rate for the period 1982 to 2017. 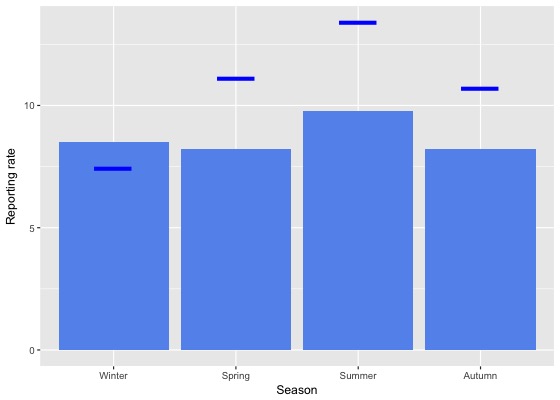
Reporting rate data
| Month | Season | ||||||||||||||||||
|---|---|---|---|---|---|---|---|---|---|---|---|---|---|---|---|---|---|---|---|
| Period | Jul | Aug | Sep | Oct | Nov | Dec | Jan | Feb | Mar | Apr | May | Jun | Winter | Spring | Summer | Autumn | All | ||
| All years | |||||||||||||||||||
| All | 9.2 | 9.9 | 7.9 | 8.4 | 8.4 | 8.3 | 10.7 | 10.4 | 7.1 | 8.1 | 9.9 | 7.0 | 8.5 | 8.2 | 9.8 | 8.2 | 8.7 | ||
| Previous years | |||||||||||||||||||
| All previous years | 9.3 | 10.3 | 7.7 | 7.9 | 7.8 | 7.6 | 10.2 | 9.7 | 6.5 | 7.5 | 10.0 | 7.1 | 8.7 | 7.8 | 9.1 | 7.7 | 8.3 | ||
| Previous 30 years | 9.1 | 9.9 | 7.6 | 7.7 | 7.5 | 7.2 | 10.0 | 9.4 | 6.4 | 7.3 | 9.6 | 6.7 | 8.4 | 7.6 | 8.8 | 7.5 | 8.0 | ||
| Previous 20 years | 9.3 | 10.8 | 7.8 | 7.9 | 7.9 | 7.0 | 10.1 | 9.7 | 6.1 | 6.9 | 10.2 | 6.2 | 8.4 | 7.9 | 8.9 | 7.4 | 8.1 | ||
| 10 year groups | |||||||||||||||||||
| [2007,2017) | 11.0 | 11.8 | 9.3 | 8.1 | 9.3 | 8.1 | 10.7 | 10.9 | 7.2 | 7.7 | 11.4 | 7.3 | 9.6 | 8.7 | 9.9 | 8.4 | 9.1 | ||
| [1997,2007) | 6.3 | 8.5 | 4.9 | 7.2 | 5.1 | 5.0 | 8.1 | 6.8 | 3.7 | 4.8 | 7.5 | 3.8 | 5.9 | 5.7 | 6.4 | 5.0 | 5.7 | ||
| [1987,1997) | 8.5 | 7.4 | 6.4 | 6.8 | 6.2 | 8.0 | 9.4 | 7.6 | 8.2 | 9.0 | 7.4 | 9.1 | 8.3 | 6.4 | 8.4 | 8.2 | 7.8 | ||
| 5 year groups | |||||||||||||||||||
| [2012,2017) | 12.2 | 12.9 | 10.3 | 8.9 | 10.4 | 9.5 | 9.8 | 10.7 | 7.8 | 8.7 | 11.8 | 8.6 | 11.0 | 9.7 | 10.0 | 9.1 | 9.9 | ||
| [2007,2012) | 7.2 | 8.1 | 6.9 | 6.7 | 6.4 | 5.2 | 13.8 | 11.6 | 5.4 | 5.5 | 10.2 | 4.9 | 6.2 | 6.7 | 9.6 | 6.5 | 7.2 | ||
| [2002,2007) | 5.9 | 8.9 | 5.9 | 8.1 | 4.4 | 5.2 | 9.3 | 7.1 | 3.8 | 5.6 | 10.1 | 3.8 | 5.8 | 6.3 | 6.8 | 5.9 | 6.2 | ||
| [1997,2002) | 7.1 | 8.0 | 3.8 | 5.8 | 5.9 | 4.8 | 6.7 | 6.4 | 3.5 | 3.9 | 4.3 | 3.9 | 6.0 | 5.1 | 5.8 | 3.8 | 5.1 | ||
| [1992,1997) | 17.2 | 11.6 | 9.4 | 11.1 | 11.4 | 11.1 | 17.4 | 12.2 | 12.7 | 13.0 | 11.4 | 13.5 | 13.8 | 10.7 | 13.8 | 12.4 | 12.6 | ||
| [1987,1992) | 4.6 | 5.2 | 4.9 | 4.4 | 3.7 | 6.6 | 5.1 | 5.9 | 5.5 | 6.8 | 5.3 | 6.7 | 5.5 | 4.3 | 5.9 | 5.9 | 5.3 | ||
| Year | |||||||||||||||||||
| 2017 | 8.5 | 8.0 | 8.8 | 12.1 | 12.1 | 13.2 | 13.5 | 13.5 | 10.6 | 12.1 | 9.4 | 6.4 | 7.4 | 11.1 | 13.4 | 10.7 | 10.9 | ||
| 2016 | 7.7 | 11.2 | 10.1 | 9.6 | 9.3 | 8.2 | 7.1 | 9.9 | 7.1 | 8.9 | 11.4 | 8.2 | 9.1 | 9.7 | 8.4 | 8.9 | 9.0 | ||
| 2015 | 16.8 | 14.3 | 12.3 | 8.1 | 8.7 | 9.2 | 7.7 | 9.1 | 7.0 | 6.9 | 9.4 | 7.0 | 11.6 | 9.5 | 8.6 | 7.6 | 9.2 | ||
| 2014 | 15.8 | 14.7 | 10.1 | 10.4 | 8.9 | 7.4 | 9.9 | 9.9 | 8.3 | 10.0 | 11.4 | 8.9 | 12.1 | 10.0 | 9.4 | 9.6 | 10.1 | ||
| 2013 | 19.5 | 20.8 | 11.1 | 7.8 | 15.6 | 10.3 | 14.8 | 11.4 | 8.1 | 9.3 | 13.4 | 10.5 | 16.4 | 10.9 | 12.2 | 9.6 | 11.8 | ||
| 2012 | 7.5 | 7.5 | 7.1 | 8.3 | 11.2 | 13.2 | 14.5 | 21.0 | 11.0 | 9.4 | 19.3 | 11.4 | 9.1 | 8.7 | 15.2 | 12.1 | 11.1 | ||
| 2011 | 10.6 | 5.6 | 5.4 | 6.7 | 5.5 | 11.3 | 16.0 | 15.1 | 5.3 | 4.1 | 8.0 | 4.9 | 6.2 | 6.1 | 14.0 | 5.7 | 8.1 | ||
| 2010 | 6.2 | 8.8 | 10.1 | 8.8 | 7.7 | 3.3 | 12.6 | 11.8 | 3.5 | 7.7 | 15.7 | 5.7 | 6.6 | 8.9 | 7.9 | 7.3 | 7.9 | ||
| 2009 | 7.2 | 15.6 | 7.9 | 5.7 | 6.2 | 2.1 | 16.0 | 7.5 | 5.6 | 4.9 | 8.4 | 4.5 | 7.7 | 6.4 | 8.1 | 5.9 | 6.8 | ||
| 2008 | 3.4 | 7.8 | 8.6 | 5.5 | 4.7 | 4.1 | 11.9 | 14.8 | 5.9 | 5.3 | 13.5 | 3.3 | 4.4 | 6.2 | 8.8 | 6.9 | 6.5 | ||
| 2007 | 9.9 | 3.7 | 2.1 | 7.5 | 7.4 | 2.7 | 11.4 | 6.1 | 6.8 | 6.4 | 9.8 | 5.5 | 5.9 | 5.9 | 6.6 | 7.3 | 6.4 | ||
| 2006 | 3.3 | 11.7 | 6.2 | 6.4 | 5.4 | 4.5 | 16.9 | 12.6 | 5.9 | 5.9 | 13.8 | 3.4 | 5.0 | 6.1 | 11.2 | 7.5 | 7.3 | ||
| 2005 | 6.6 | 11.2 | 6.3 | 7.2 | 6.9 | 4.4 | 5.7 | 8.7 | 4.8 | 5.5 | 13.9 | 4.6 | 6.5 | 6.7 | 5.6 | 8.0 | 6.8 | ||
| 2004 | 8.3 | 8.6 | 7.2 | 15.1 | 6.4 | 3.7 | 6.7 | 6.1 | 3.1 | 6.0 | 6.8 | 5.5 | 7.6 | 9.4 | 5.2 | 5.0 | 6.9 | ||
| 2003 | 9.4 | 6.5 | 7.2 | 8.8 | 3.2 | 3.0 | 3.7 | 4.4 | 2.2 | 5.5 | 5.4 | 3.7 | 6.2 | 6.3 | 3.6 | 4.2 | 5.1 | ||
| 2002 | 1.7 | 7.6 | 2.0 | 6.0 | 1.5 | 8.6 | 11.3 | 5.3 | 1.8 | 4.8 | 5.9 | 1.6 | 3.1 | 3.3 | 8.5 | 3.6 | 4.8 | ||
| 2001 | 3.6 | 3.0 | 1.5 | 3.4 | 3.4 | 1.8 | 4.5 | 3.1 | 3.0 | 3.4 | 2.9 | 2.5 | 3.0 | 2.5 | 3.0 | 3.1 | 2.9 | ||
| 2000 | 4.0 | 9.2 | 2.8 | 3.5 | 6.5 | 4.0 | 6.2 | 5.2 | 2.0 | 3.1 | 3.6 | 1.1 | 4.5 | 4.3 | 5.1 | 2.8 | 4.2 | ||
| 1999 | 23.5 | 11.3 | 4.0 | 5.0 | 4.5 | 8.1 | 6.6 | 6.4 | 5.9 | 4.1 | 5.1 | 8.4 | 10.7 | 4.5 | 7.1 | 5.0 | 6.5 | ||
| 1998 | 5.4 | 11.3 | 5.7 | 10.9 | 8.0 | 4.7 | 11.8 | 13.2 | 3.2 | 10.3 | 7.4 | 4.0 | 6.7 | 7.9 | 8.8 | 5.7 | 7.5 | ||
| 1997 | 14.9 | 10.3 | 10.0 | 15.8 | 8.5 | 9.6 | 11.8 | 15.8 | 5.0 | 3.7 | 6.7 | 1.4 | 9.2 | 10.9 | 11.8 | 4.6 | 9.4 | ||
| 1996 | 10.4 | 8.5 | 9.3 | 10.5 | 12.0 | 10.1 | 16.5 | 8.2 | 8.8 | 12.5 | 24.1 | 16.1 | 11.7 | 10.8 | 11.8 | 13.8 | 11.9 | ||
| 1995 | 19.4 | 14.0 | 5.8 | 7.9 | 5.5 | 16.1 | 17.7 | 6.3 | 20.4 | 11.3 | 10.4 | 10.6 | 14.6 | 6.6 | 14.4 | 14.0 | 12.0 | ||
| 1994 | 13.7 | 13.0 | 10.3 | 12.8 | 8.8 | 4.3 | 19.1 | 13.8 | 13.6 | 11.5 | 8.8 | 12.4 | 12.9 | 10.3 | 13.4 | 11.4 | 11.8 | ||
| 1993 | 22.4 | 12.8 | 8.1 | 21.3 | 21.2 | 10.9 | 16.3 | 21.9 | 7.4 | 18.3 | 7.8 | 14.5 | 15.8 | 17.2 | 15.7 | 10.6 | 14.7 | ||
| 1992 | 20.0 | 7.4 | 14.1 | 7.4 | 15.3 | 11.1 | 17.2 | 19.5 | 12.7 | 15.3 | 9.2 | 15.0 | 14.5 | 12.0 | 15.4 | 12.1 | 13.3 | ||
| 1991 | 5.5 | 5.3 | 5.8 | 11.7 | 9.3 | 9.5 | 19.6 | 16.0 | 15.9 | 18.6 | 14.8 | 16.0 | 7.4 | 9.1 | 14.4 | 16.4 | 11.1 | ||
| 1990 | 6.5 | 5.4 | 6.5 | 4.1 | 2.8 | 16.7 | 9.7 | 14.1 | 8.0 | 10.7 | 11.0 | 10.5 | 6.7 | 4.4 | 13.5 | 9.8 | 8.0 | ||
| 1989 | 3.1 | 6.0 | 4.4 | 3.8 | 3.5 | 6.1 | 2.7 | 3.6 | 3.9 | 5.6 | 4.6 | 7.1 | 5.4 | 3.9 | 4.2 | 4.7 | 4.5 | ||
| 1988 | 3.0 | 3.4 | 5.1 | 2.7 | 2.4 | 2.6 | 2.0 | 4.6 | 2.5 | 5.3 | 4.5 | 4.3 | 3.5 | 3.2 | 3.0 | 4.1 | 3.4 | ||
| 1987 | 27.3 | 20.0 | 4.5 | 3.9 | 3.6 | 6.6 | 4.6 | 4.2 | 5.7 | 4.5 | 2.2 | 4.9 | 7.0 | 3.9 | 5.1 | 4.1 | 4.6 | ||
| 1986 | 7.7 | 15.8 | 11.3 | 22.2 | 10.6 | 17.6 | 21.7 | 13.9 | 12.9 | 7.8 | 17.2 | 17.1 | 14.1 | 14.0 | 17.2 | 11.7 | 14.1 | ||
| 1985 | 13.3 | 10.0 | 11.5 | 10.5 | 7.0 | 16.7 | 62.5 | 47.1 | 45.5 | 36.8 | 40.0 | 21.4 | 14.8 | 9.7 | 27.1 | 40.0 | 17.4 | ||
| 1984 | 80.0 | 40.0 | 100.0 | 50.0 | 100.0 | 50.0 | 13.8 | 18.2 | 3.7 | 17.6 | 19.4 | 23.5 | 32.7 | 71.4 | 21.6 | 14.1 | 25.4 | ||
| 1983 | 83.3 | 75.0 | 60.0 | 61.5 | 77.8 | 53.8 | 83.3 | 54.5 | 100.0 | - | 83.3 | 63.6 | 72.4 | 66.7 | 60.0 | 85.7 | 69.0 | ||
| 1982 | - | 54.5 | - | 0.0 | 62.5 | 64.3 | - | 54.5 | - | 69.2 | - | 50.0 | 52.0 | 55.6 | 60.0 | 69.2 | 58.3 | ||
Breeding data
Breeding records by month
Number of breeding records by breeding code and month, 2017 and all years| Breeding code | Jul | Aug | Sep | Oct | Nov | Dec | Jan | Feb | Mar | Apr | May | Jun |
|---|---|---|---|---|---|---|---|---|---|---|---|---|
| 2017 | ||||||||||||
| Breeding (BLA code) | 0 | 0 | 0 | 0 | 1 | 0 | 0 | 0 | 0 | 0 | 0 | 0 |
| Carrying Food | 0 | 0 | 0 | 0 | 0 | 0 | 0 | 0 | 0 | 0 | 0 | 0 |
| Copulating | 0 | 0 | 0 | 0 | 0 | 0 | 0 | 0 | 0 | 0 | 0 | 0 |
| Display | 0 | 0 | 0 | 0 | 0 | 0 | 0 | 0 | 0 | 0 | 0 | 0 |
| Dependent young | 0 | 2 | 20 | 57 | 41 | 35 | 10 | 6 | 6 | 5 | 0 | 7 |
| Faecal sac | 0 | 0 | 0 | 0 | 0 | 0 | 0 | 0 | 0 | 0 | 0 | 0 |
| Inspecting hollow | 0 | 0 | 0 | 0 | 0 | 0 | 0 | 0 | 0 | 0 | 0 | 0 |
| Nest building | 0 | 1 | 0 | 1 | 0 | 0 | 0 | 0 | 0 | 0 | 0 | 0 |
| Nest with eggs | 0 | 1 | 1 | 0 | 1 | 0 | 0 | 0 | 0 | 0 | 0 | 0 |
| Nest with young | 0 | 0 | 0 | 1 | 0 | 0 | 0 | 0 | 0 | 0 | 0 | 0 |
| On/leaving nest | 3 | 12 | 11 | 8 | 2 | 0 | 0 | 2 | 1 | 0 | 0 | 0 |
| All years | ||||||||||||
| Breeding (BLA code) | 8 | 11 | 13 | 26 | 18 | 10 | 9 | 0 | 0 | 3 | 9 | 1 |
| Carrying Food | 0 | 0 | 0 | 0 | 0 | 0 | 0 | 0 | 0 | 0 | 0 | 0 |
| Copulating | 0 | 1 | 0 | 0 | 0 | 0 | 0 | 0 | 1 | 0 | 0 | 0 |
| Display | 2 | 0 | 2 | 0 | 0 | 0 | 0 | 0 | 0 | 0 | 0 | 0 |
| Dependent young | 16 | 42 | 104 | 269 | 130 | 90 | 58 | 28 | 20 | 24 | 17 | 30 |
| Faecal sac | 0 | 0 | 0 | 0 | 0 | 0 | 0 | 0 | 0 | 0 | 1 | 0 |
| Inspecting hollow | 0 | 1 | 0 | 0 | 0 | 0 | 0 | 0 | 0 | 0 | 0 | 0 |
| Nest building | 1 | 3 | 3 | 3 | 0 | 0 | 0 | 3 | 1 | 0 | 3 | 2 |
| Nest with eggs | 1 | 8 | 5 | 2 | 2 | 0 | 0 | 0 | 1 | 3 | 1 | 0 |
| Nest with young | 1 | 0 | 1 | 4 | 1 | 1 | 0 | 0 | 0 | 0 | 1 | 1 |
| On/leaving nest | 18 | 50 | 37 | 30 | 11 | 5 | 5 | 3 | 4 | 11 | 7 | 9 |
Breeding records by year
Average number of breeding records per period by breeding code| Period | Breeding (BLA code) | Carrying Food | Copulating | Display | Dependent young | Faecal sac | Inspecting hollow | Nest building | Nest with eggs | Nest with young | On/leaving nest |
|---|---|---|---|---|---|---|---|---|---|---|---|
| All years | |||||||||||
| All | 3.0 | 0.0 | 0.1 | 0.1 | 23.0 | 0.0 | 0.0 | 0.5 | 0.6 | 0.3 | 5.3 |
| Previous years | |||||||||||
| All previous years | 3.1 | 0.0 | 0.1 | 0.1 | 18.3 | 0.0 | 0.0 | 0.5 | 0.6 | 0.3 | 4.3 |
| Previous 30 years | 3.6 | 0.0 | 0.1 | 0.1 | 19.9 | 0.0 | 0.0 | 0.6 | 0.6 | 0.3 | 4.7 |
| Previous 20 years | 4.7 | 0.0 | 0.1 | 0.2 | 25.2 | 0.0 | 0.0 | 0.6 | 0.4 | 0.4 | 5.8 |
| 10 year groups | |||||||||||
| [2007,2017) | 6.0 | 0.0 | 0.2 | 0.4 | 35.9 | 0.1 | 0.1 | 1.0 | 0.8 | 0.7 | 8.2 |
| [1997,2007) | 3.4 | 0.0 | 0.0 | 0.0 | 14.5 | 0.0 | 0.0 | 0.2 | 0.0 | 0.1 | 3.4 |
| [1987,1997) | 1.3 | 0.0 | 0.0 | 0.0 | 9.4 | 0.0 | 0.0 | 0.5 | 1.1 | 0.1 | 2.5 |
| 5 year groups | |||||||||||
| [2012,2017) | 5.4 | 0.0 | 0.4 | 0.8 | 38.4 | 0.0 | 0.2 | 1.2 | 0.4 | 0.8 | 10.6 |
| [2007,2012) | 6.6 | 0.0 | 0.0 | 0.0 | 33.4 | 0.2 | 0.0 | 0.8 | 1.2 | 0.6 | 5.8 |
| [2002,2007) | 2.2 | 0.0 | 0.0 | 0.0 | 17.2 | 0.0 | 0.0 | 0.2 | 0.0 | 0.2 | 3.2 |
| [1997,2002) | 4.6 | 0.0 | 0.0 | 0.0 | 11.8 | 0.0 | 0.0 | 0.2 | 0.0 | 0.0 | 3.6 |
| [1992,1997) | 2.6 | 0.0 | 0.0 | 0.0 | 12.0 | 0.0 | 0.0 | 0.2 | 0.0 | 0.0 | 2.0 |
| [1987,1992) | 0.0 | 0.0 | 0.0 | 0.0 | 6.8 | 0.0 | 0.0 | 0.8 | 2.2 | 0.2 | 3.0 |
| Year | |||||||||||
| 2017 | 1.0 | 0.0 | 0.0 | 0.0 | 189.0 | 0.0 | 0.0 | 2.0 | 3.0 | 1.0 | 39.0 |
| 2016 | 0.0 | 0.0 | 0.0 | 2.0 | 62.0 | 0.0 | 1.0 | 2.0 | 0.0 | 2.0 | 19.0 |
| 2015 | 1.0 | 0.0 | 1.0 | 2.0 | 56.0 | 0.0 | 0.0 | 1.0 | 1.0 | 1.0 | 13.0 |
| 2014 | 2.0 | 0.0 | 1.0 | 0.0 | 17.0 | 0.0 | 0.0 | 1.0 | 0.0 | 1.0 | 7.0 |
| 2013 | 9.0 | 0.0 | 0.0 | 0.0 | 25.0 | 0.0 | 0.0 | 1.0 | 0.0 | 0.0 | 7.0 |
| 2012 | 15.0 | 0.0 | 0.0 | 0.0 | 32.0 | 0.0 | 0.0 | 1.0 | 1.0 | 0.0 | 7.0 |
| 2011 | 1.0 | 0.0 | 0.0 | 0.0 | 33.0 | 0.0 | 0.0 | 0.0 | 4.0 | 0.0 | 10.0 |
| 2010 | 18.0 | 0.0 | 0.0 | 0.0 | 52.0 | 0.0 | 0.0 | 3.0 | 1.0 | 0.0 | 6.0 |
| 2009 | 3.0 | 0.0 | 0.0 | 0.0 | 32.0 | 0.0 | 0.0 | 0.0 | 1.0 | 0.0 | 5.0 |
| 2008 | 6.0 | 0.0 | 0.0 | 0.0 | 37.0 | 1.0 | 0.0 | 0.0 | 0.0 | 3.0 | 8.0 |
| 2007 | 5.0 | 0.0 | 0.0 | 0.0 | 13.0 | 0.0 | 0.0 | 1.0 | 0.0 | 0.0 | 0.0 |
| 2006 | 2.0 | 0.0 | 0.0 | 0.0 | 30.0 | 0.0 | 0.0 | 0.0 | 0.0 | 1.0 | 10.0 |
| 2005 | 5.0 | 0.0 | 0.0 | 0.0 | 19.0 | 0.0 | 0.0 | 0.0 | 0.0 | 0.0 | 3.0 |
| 2004 | 1.0 | 0.0 | 0.0 | 0.0 | 17.0 | 0.0 | 0.0 | 0.0 | 0.0 | 0.0 | 2.0 |
| 2003 | 1.0 | 0.0 | 0.0 | 0.0 | 12.0 | 0.0 | 0.0 | 1.0 | 0.0 | 0.0 | 1.0 |
| 2002 | 2.0 | 0.0 | 0.0 | 0.0 | 8.0 | 0.0 | 0.0 | 0.0 | 0.0 | 0.0 | 0.0 |
| 2001 | 4.0 | 0.0 | 0.0 | 0.0 | 4.0 | 0.0 | 0.0 | 0.0 | 0.0 | 0.0 | 3.0 |
| 2000 | 4.0 | 0.0 | 0.0 | 0.0 | 7.0 | 0.0 | 0.0 | 0.0 | 0.0 | 0.0 | 1.0 |
| 1999 | 4.0 | 0.0 | 0.0 | 0.0 | 31.0 | 0.0 | 0.0 | 0.0 | 0.0 | 0.0 | 3.0 |
| 1998 | 0.0 | 0.0 | 0.0 | 0.0 | 5.0 | 0.0 | 0.0 | 0.0 | 0.0 | 0.0 | 5.0 |
| 1997 | 11.0 | 0.0 | 0.0 | 0.0 | 12.0 | 0.0 | 0.0 | 1.0 | 0.0 | 0.0 | 6.0 |
| 1996 | 5.0 | 0.0 | 0.0 | 0.0 | 11.0 | 0.0 | 0.0 | 0.0 | 0.0 | 0.0 | 3.0 |
| 1995 | 8.0 | 0.0 | 0.0 | 0.0 | 22.0 | 0.0 | 0.0 | 1.0 | 0.0 | 0.0 | 2.0 |
| 1994 | 0.0 | 0.0 | 0.0 | 0.0 | 11.0 | 0.0 | 0.0 | 0.0 | 0.0 | 0.0 | 4.0 |
| 1993 | 0.0 | 0.0 | 0.0 | 0.0 | 8.0 | 0.0 | 0.0 | 0.0 | 0.0 | 0.0 | 0.0 |
| 1992 | 0.0 | 0.0 | 0.0 | 0.0 | 8.0 | 0.0 | 0.0 | 0.0 | 0.0 | 0.0 | 1.0 |
| 1991 | 0.0 | 0.0 | 0.0 | 0.0 | 1.0 | 0.0 | 0.0 | 1.0 | 0.0 | 0.0 | 6.0 |
| 1990 | 0.0 | 0.0 | 0.0 | 0.0 | 9.0 | 0.0 | 0.0 | 0.0 | 3.0 | 1.0 | 2.0 |
| 1989 | 0.0 | 0.0 | 0.0 | 0.0 | 10.0 | 0.0 | 0.0 | 2.0 | 5.0 | 0.0 | 7.0 |
| 1988 | 0.0 | 0.0 | 0.0 | 0.0 | 8.0 | 0.0 | 0.0 | 1.0 | 2.0 | 0.0 | 0.0 |
| 1987 | 0.0 | 0.0 | 0.0 | 0.0 | 6.0 | 0.0 | 0.0 | 0.0 | 1.0 | 0.0 | 0.0 |
| 1986 | 0.0 | 0.0 | 0.0 | 0.0 | 1.0 | 0.0 | 0.0 | 0.0 | 0.0 | 0.0 | 2.0 |
| 1985 | 0.0 | 0.0 | 0.0 | 0.0 | 12.0 | 0.0 | 0.0 | 0.0 | 0.0 | 0.0 | 2.0 |
| 1984 | 0.0 | 0.0 | 0.0 | 0.0 | 17.0 | 0.0 | 0.0 | 0.0 | 0.0 | 0.0 | 5.0 |
| 1983 | 0.0 | 0.0 | 0.0 | 0.0 | 10.0 | 0.0 | 0.0 | 0.0 | 1.0 | 0.0 | 1.0 |
| 1982 | 0.0 | 0.0 | 0.0 | 0.0 | 1.0 | 0.0 | 0.0 | 0.0 | 0.0 | 0.0 | 0.0 |
Distribution map
Distribution - 2017
This map shows the observed distribution of the Black Swan for 2017.
The red circles are the grid cells where Black Swan have been reported.
The transparency of the red circles indicate how many surveys sheets were submitted for that grid cell; the darker the red the more reliable the data. Of the 315 grid cells with reports, 83 had only one sheet; an example is grid number J4.
The size of the circle represents the reporting rate. The maximum reporting rate for Black Swan was 100.0% (eg grid number J4) and the minimum was 0.1% (eg grid number K15). 
Distribution - all years
This map shows the observed distribution of the Black Swan for all years.
The red circles are the grid cells where Black Swan have been reported.
The transparency of the red circles indicate how many surveys sheets were submitted for that grid cell; the darker the red the more reliable the data. Of the 703 grid cells with reports, 55 had only one sheet; an example is grid number A12.
The size of the circle represents the reporting rate. The maximum reporting rate for Black Swan was 83.8% (eg grid number R6) and the minimum was 0.0% (eg grid number K16). 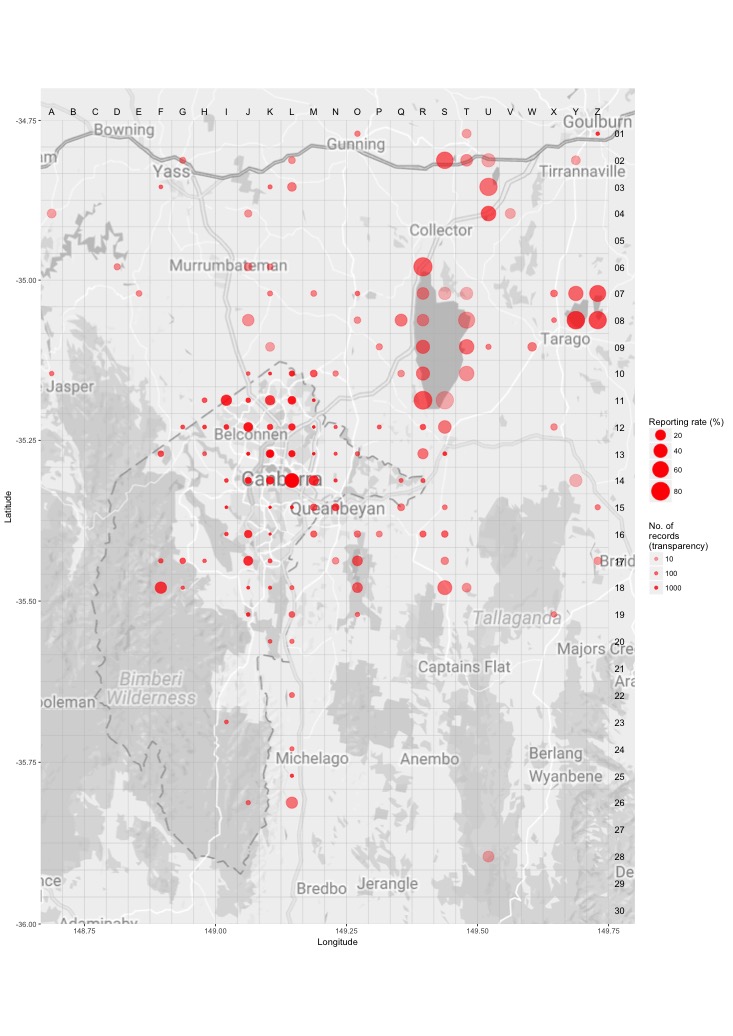
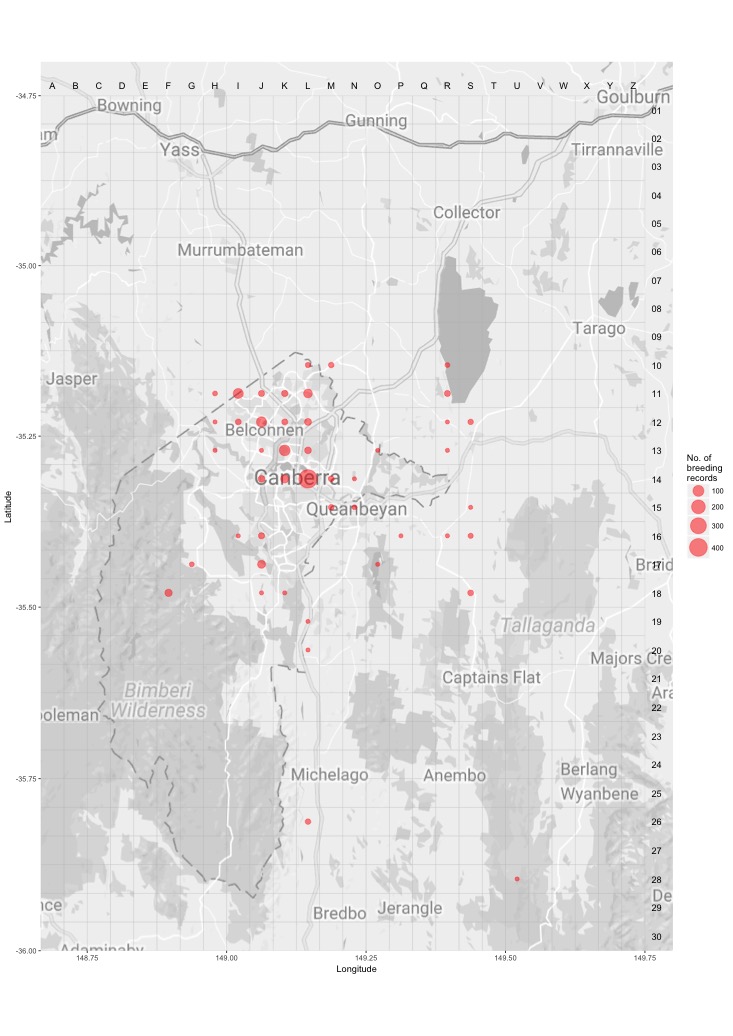
Breeding map
Breeding - 2017
This map shows the breeding distribution of the Black Swan for 2017.
The red circles are the grid cells where breeding activity for Black Swan have been reported.
The size of the circle represents the number of reports. 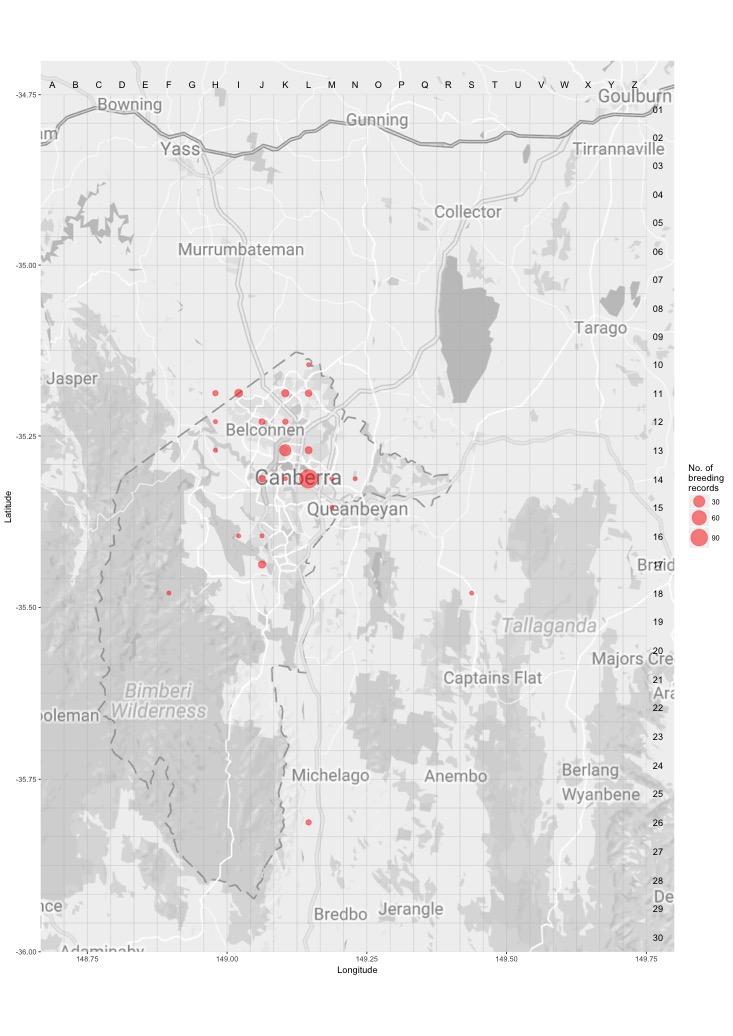
Breeding - all years
This map shows the breeding distribution of the Black Swan for all years.
The red circles are the grid cells where breeding activity for Black Swan have been reported.
The size of the circle represents the number of reports.